Digital Equity Ecosystems are the interactions between individuals, populations, communities, and their larger sociotechnical environments that all play a role in shaping the digital inclusion work in local communities to promote more equitable access to technology and social and racial justice.
—Rhinesmith and Kennedy
Dr. Colin Rhinesmith from the Digital Equity Research Center and Susan Kennedy from the Community Informatics Lab at Simmons University developed the concept of “digital equity ecosystems” as a way to more deeply understand the local, cultural drivers and social barriers to broadband adoption as a starting point for promoting digital equity, as well as to understand how community-based coalitions responded to the triple challenges of the COVID-19 pandemic, racial injustice, and digital inequality. Published by the Benton Institute for Broadband & Society, Growing Healthy Digital Equity Ecosystems During COVID-19 and Beyond provided one of the first national studies of digital inclusion coalitions in the United States.
This way of thinking about digital inequalities can assist researchers, practitioners, and policymakers in seeing the creative and innovative community-based solutions that have emerged in response to the COVID-19 pandemic, particularly in poor communities and communities of color that were disproportionately impacted by the coronavirus. State broadband offices are required to work with digital inclusion coalitions, and a digital equity ecosystems approach can offer a framework to develop and implement digital equity plans together.
Dr. Rhinesmith has also worked with Dr. Rafi Santo to develop a measurement framework to better understand the data and evaluation needs of community coalitions.
Measuring Digital Equity
Principles 9 and 10 highlight the critical need for accountability in digital equity work, and the role of metrics and evaluation in ensuring such accountability. Measurement is essential to documenting and understanding a community’s path to digital equity. Sharing learnings within a community or between different communities requires not just quality data but also a measurement framework that approximates the complex problems and ultimate goal of digital equity.
Many researchers and practitioners have developed a variety of indices, scorecards, maps, and data visualization tools to measure and display different aspects of digital equity, using a range of publicly available datasets, most notably the American Community Survey, the Federal Communications Commission’s Form 477 Fixed Broadband Deployment Data, speed test data from Ookla and M-lab, and broadband usage data from Microsoft’s Airband initiative. No one tool is applicable in all circumstances. Rather, the tools listed herein have specific purposes and aim to offer actionable insights.
Federal agencies have been directed by recent legislation to demonstrate the impact of the investment in broadband. To that end, the Census Bureau and the National Telecommunications and Information Administration have created the ACCESS BROADBAND dashboard, which connects the changes in broadband availability and adoption to economic development. Displaying indicators such as employment, small- business establishments, wages and income, poverty, home values, population change and migration, educational attainment, and gross domestic product (GDP), the interactive dashboard can offer an evolving picture of how broadband could impact local economies.
Tying technology indicators to not just socioeconomic indicators but also education and housing presents a multifaceted picture of the quality of life in a city and makes the case for interdependent strategies to direct investment. The Digital Advancement Municipal Index uses 16 key indicators across four categories to profile cities’ prosperity in the digital economy.
Mapping tools, such as the 2021 Digital Divide Index (DDI), allow users to see how digital inequity intersects with other social inequities. Developed by Dr. Roberto Gallardo of Purdue University’s Center for Regional Development, the DDI combines data on broadband infrastructure and adoption with socioeconomic indicators that are known to impact technology adoption to present a picture of the digital divide at a county or census-tract level.
The National Digital Inclusion Alliance’s Digital Equity Scorecard employs another, narrower benchmarking approach that homes in on whether and how much states are investing in digital skills. Using data from the Department of Labor’s Bureau of Labor Statistics, the scorecard compiles data on whether and to what extent states recognize the need for investment in digital skills and have put in place appropriate plans to address such gaps.
The Maryland Digital Equity Index allows for comparisons among different areas within the state to help diagnose where investment and attention is needed. Created in partnership between Dr. John Horrigan of the Benton Institute for Broadband & Society, Dr. Seema Iyer of the Baltimore Neighborhood Indicators Alliance—Jacob France Institute, and the Community Development Network of Maryland, the index combines internet subscription and device access data with demographic data at the zip code level. The index can demonstrate geographic disparities, for instance, showing that the majority of those without internet access in the state live in urban areas.
The New York State Digital Equity Portal is also focused on a particular state, but in addition to subscription data and demographic data, it also includes BroadbandNow’s data on internet package prices and Ookla speed test data. Developed by the New York State Library, the John R. Oishei Foundation, Community Tech New York, and the Cornell University ILR School Buffalo Co-Lab, the portal allows for granular detail and multiple map layers, displaying results by zip code and congressional districts.
Frameworks Focused on How Local Coalitions Promote Digital Equity
Beyond using large public datasets, the digital equity community is also developing new frameworks that focus on how local coalitions are working to promote digital inclusion, equity, and justice in and with other members of their communities. Two such approaches are the Digital Equity Ecosystems Measurement (DEEM) Framework and the Digital Opportunities Compass.
Digital Equity Ecosystems Measurement Framework
The Digital Equity Ecosystems Measurement (DEEM) Framework, developed by Dr. Colin Rhinesmith and Dr. Rafi Santo, aims to better understand the data and evaluation needs of community coalitions. This participatory design research project convened 32 digital equity and digital justice coalition leaders and members.
Rhinesmith and Santo chose participatory design as a research methodology because it is an effective tool to engage coalitions in co-designing tools to evaluate and assess their community work. Participatory design helps empower people across a wide range of disciplines, including community informatics, a field of research and practice focused on advancing digital inclusion, equity, and justice.
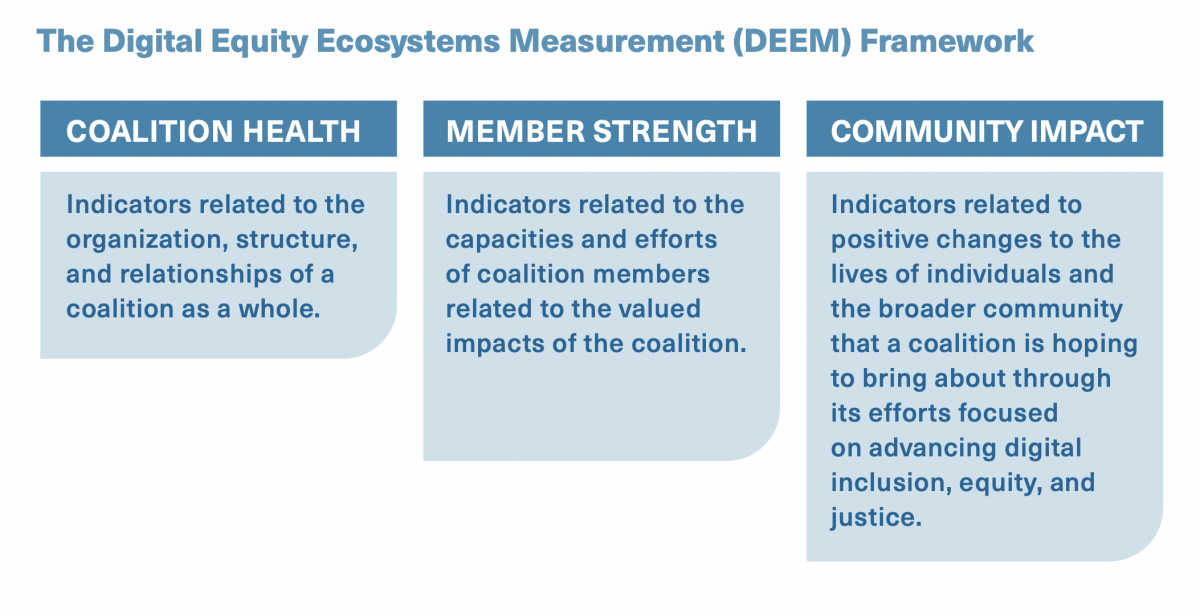
The DEEM framework provides local coalitions a way to both understand and measure the health, strength, and impacts of their efforts alongside their communities. The framework includes indicators at each of the three measurement levels that local coalitions can use to gather data to inform planning, improvement, and argumentation.
The DEEM framework assumes that coalitions focused on digital inclusion, equity, and justice vary in the specifics of their goals and structure, as well as in how they define what success looks like. Some coalitions engage in advocacy-related work in order to enact policy change, leveraging collective voice, aligned commitments, and specialized roles within campaigns that result in shifts in local or state policies that directly impact community-level outcomes. Other coalitions engage in direct service provision themselves, as in the case of facilitating Digital Navigator programs.
Still others aim to support members through capacity-building opportunities or through funds to develop and implement new community-based services addressing digital equity issues. The indicators offered by the DEEM framework are meant to serve as a menu of options—rather than a strict, hierarchical formula—for coalitions to draw from as they strategize how data can play a role in advancing their work.
Depending on the goals, structure, and stage of development of a given coalition, some indicators might be more useful than others. Rhinesmith and Santo highlight how specific purposes of data use might leverage distinct indicators across the DEEM framework in order to address particular needs. The specific lists of indicators in each of the three levels of the framework offer coalitions opportunities to discuss data gathering to meet their needs and goals both internally and externally with other stakeholder groups in their communities. We also provide concrete suggestions and examples to help coalitions see how to use the DEEM framework in practice.
DEEM Framework Example Indicators
- Coalition Health—member participation, clarity of opportunities, sense of belonging, internal alignment, collective efficacy, community representation, responsive governance
- Member Strength—member focus, capacity, geographic reach, demographic reach, equity orientation
- Community Impact (i.e., digital inclusion, equity, and justice indicators)—community-wide digital access and skills; community use of technology for civic, educational, health, and social connection; community ownership over technology and media.
The DEEM framework can help coalitions gather data to improve their planning and implementation. It can also be used for argumentation, to make the case in front of external stakeholders, such as policymakers and funders, who might want to better understand the community impact of coalition work on the ground.
Digital Opportunities Compass
In order to be best prepared for the investment made possible through the Broadband Equity, Access, and Deployment (BEAD) and Digital Equity Act programs established by Congress in the Infrastructure Investment and Jobs Act, digital equity researchers have also begun to collaborate on frameworks to understand the full impact of these programs in communities beyond access and affordability. The Digital Opportunities Compass, authored by Colin Rhinesmith, Pierrette Renée Dagg, Johannes M. Bauer, Greta Byrum, and Aaron Schill, presents a way for communities and states to develop a shared understanding of holistic digital equity, assess the current situation, and identify areas that require action.
The Digital Opportunities Compass offers a customizable approach to utilize a coherent set of indicators and metrics to create a baseline assessment of the state of digital equity, in order to monitor changes over time and evaluate the effectiveness of interventions to improve digital equity.
The Digital Opportunities Compass includes six components: Contexts, Governance, Connectivity, Skills, Application, and Outcomes. Each component includes indicators that have a bearing on the process and outcomes of digital equity initiatives on the ground. The indicators under each component allow stakeholders to do an assessment of their overall conditions in order to determine where additional areas of attention may be needed.

- CONTEXTS – indicators related to sociodemographic, economic, and community level factors.
- GOVERNANCE – indicators related to local, state, and federal policy, governance, and power.
- CONNECTIVITY – indicators related to the existence of necessary network infrastructure, as well as the accessibility, affordability, and adoption of internet service and network-enabled devices.
- SKILLS – indicators related to a broad range of activities centered around digital literacy (including secure online practices), training, and skills attainment.
- APPLICATION – indicators related to the uses and application of digital connectivity and skills, while considering additional sociotechnical contexts.
- OUTCOMES – indicators related to the broader effects of improved digital equity on individuals, communities, and states.
The Digital Opportunities Compass can be used to:
- Identify key groups of factors that influence digital equity efforts and outcomes
- Measure and assess digital equity efforts and outcomes over time
- Utilize a standardized core set of metrics that can be expanded and customized to meet state and community needs
- Build, as far as possible, on existing data and indices
- Augment existing data with new (qualitative and quantitative) data
- Innovatively design infrastructure to help automate data collection (e.g., quality measurement in routers)
The Digital Opportunities Compass can be used as part of focus groups, in capacity-building programs for planners and decision-makers, or to facilitate the multi-stakeholder digital equity planning process. The researchers hope that the Digital Opportunities Compass encourages deeper discussion, debate, and reflection on how to measure digital equity.